How has cancer incidence in Canada changed over the years?
The goal with this project was to create an interactive visualization of cancer incidence in Canada using Shiny. This project was jointly created by myself and MDS classmate Constantin Shuster.
This Shiny web application is currently deployed at:
https://rachelkriggs.shinyapps.io/shiny/
The code for this project can be found in the project’s Github repository.
In particular, the code for the Shiny app specifically can be found here.
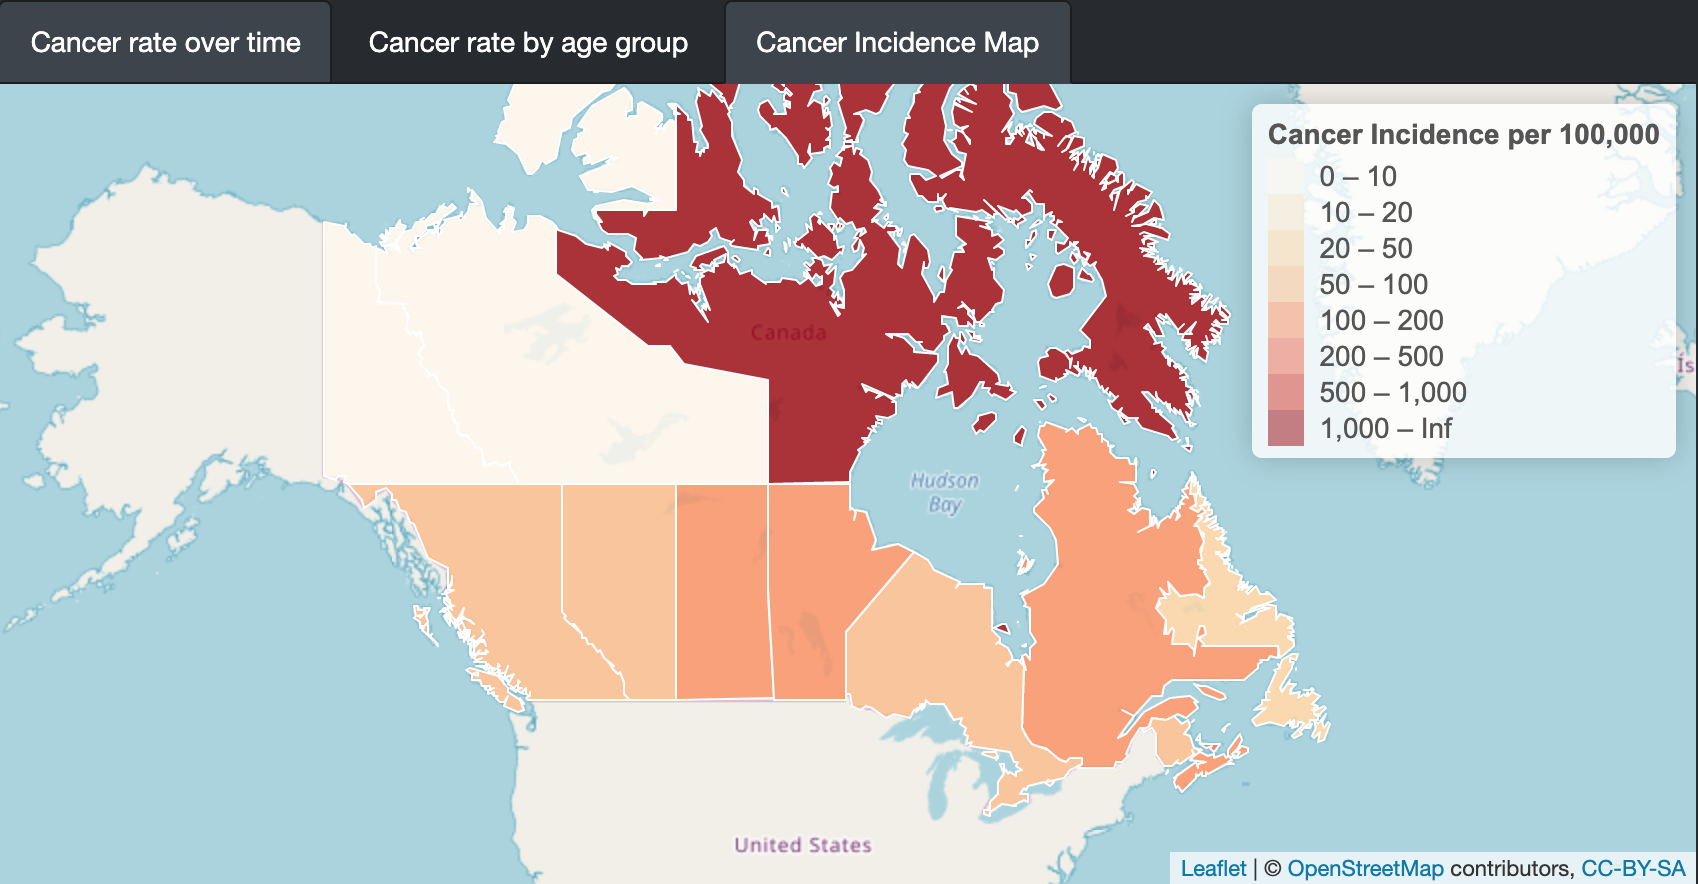
The dataset was published by Statistics Canada who maintains the Canadian Cancer Registry. Cancer incidence rates in this dataset refer to the amount of new primary malignant cancer cases on an annual basis per 100,000 people. Data was not available for Quebec after 2010, thus for comparison purposes cancer incidence rates for Canada excluding Quebec were created for all years. In 2014, Ontario implemented a new reporting system - the Ontario Cancer Registry. The new enhanced system permitted the identification of cancers that perviously were unrecorded. It also permitted counting multiple primary sites. This impacted data from year 2010 onwards.
The tools we used to produce this analysis included RStudio, Shiny, and Make.