Chocolate bar ratings analysis
Have you ever wondered where the cacao beans of your favourite chocolate bar came from, and whether that has an effect on how good it tastes?
To investigate this further, myself and MDS classmate Carrie Cheung needed some very delicious chocolate data – we used this chocolate bar ratings dataset from Kaggle, which contains ratings by chocolate experts on over 1,795 individual chocolate bars. The dataset includes additional information about the chocolate bars, including where the chocolate beans were grown, cocoa percentage, and bean variety.
Since Venezuela is one of the largest producers of the Criollo bean, which is considered a delicacy, we set out to answer the following question using the chocolate bar ratings dataset:
Do chocolate bars made from beans grown in Venezuela have a different average rating compared to beans grown elsewhere?
The code for this project can be found in the project’s Github repository and the analysis can be reproduced by following the instructions in the Readme file.
The tools we used to produce this analysis included RStudio, Make, and Docker.
Data
The data set contains ratings by chocolate experts on over 1,792 individual chocolate bars over the period of 2006 to 2017. According to Kaggle’s description, “[t]he database is narrowly focused on plain dark chocolate with an aim of appreciating the flavors of the cacao when made into chocolate.” Each row presents information about a single chocolate bar. The first few rows of the original data set are shown here:
Table 1. First three rows of original chocolate bar dataset.
| Company Maker if known | Specific Bean Origin or Bar Name | REF | Review Date | Cocoa Percent | Company Location | Rating | Bean Type | Broad Bean Origin |
|---|---|---|---|---|---|---|---|---|
| A. Morin | Agua Grande | 1876 | 2016 | 63% | France | 3.75 | Sao Tome | |
| A. Morin | Kpime | 1676 | 2015 | 70% | France | 2.75 | Togo | |
| A. Morin | Atsane | 1676 | 2015 | 70% | France | 3.00 | Togo |
Although the data includes additional information about the chocolate bars, including where the chocolate beans were grown, cocoa percentage, and bean variety, we are specifically focusing on 2 columns for this analysis:
-
“Ratings” (which are specific ratings for bars of chocolate that range from 1 to 5, with 1 being ‘Unpleasant’ and 5 being ‘Elite’), and:
-
“Broad Bean Origin” (which is the broad geo-region of origin for the bean, typically a country).
71 rows were removed that were missing a location for the bean origin, with 1721 rows remaining.
Average Ratings by Country
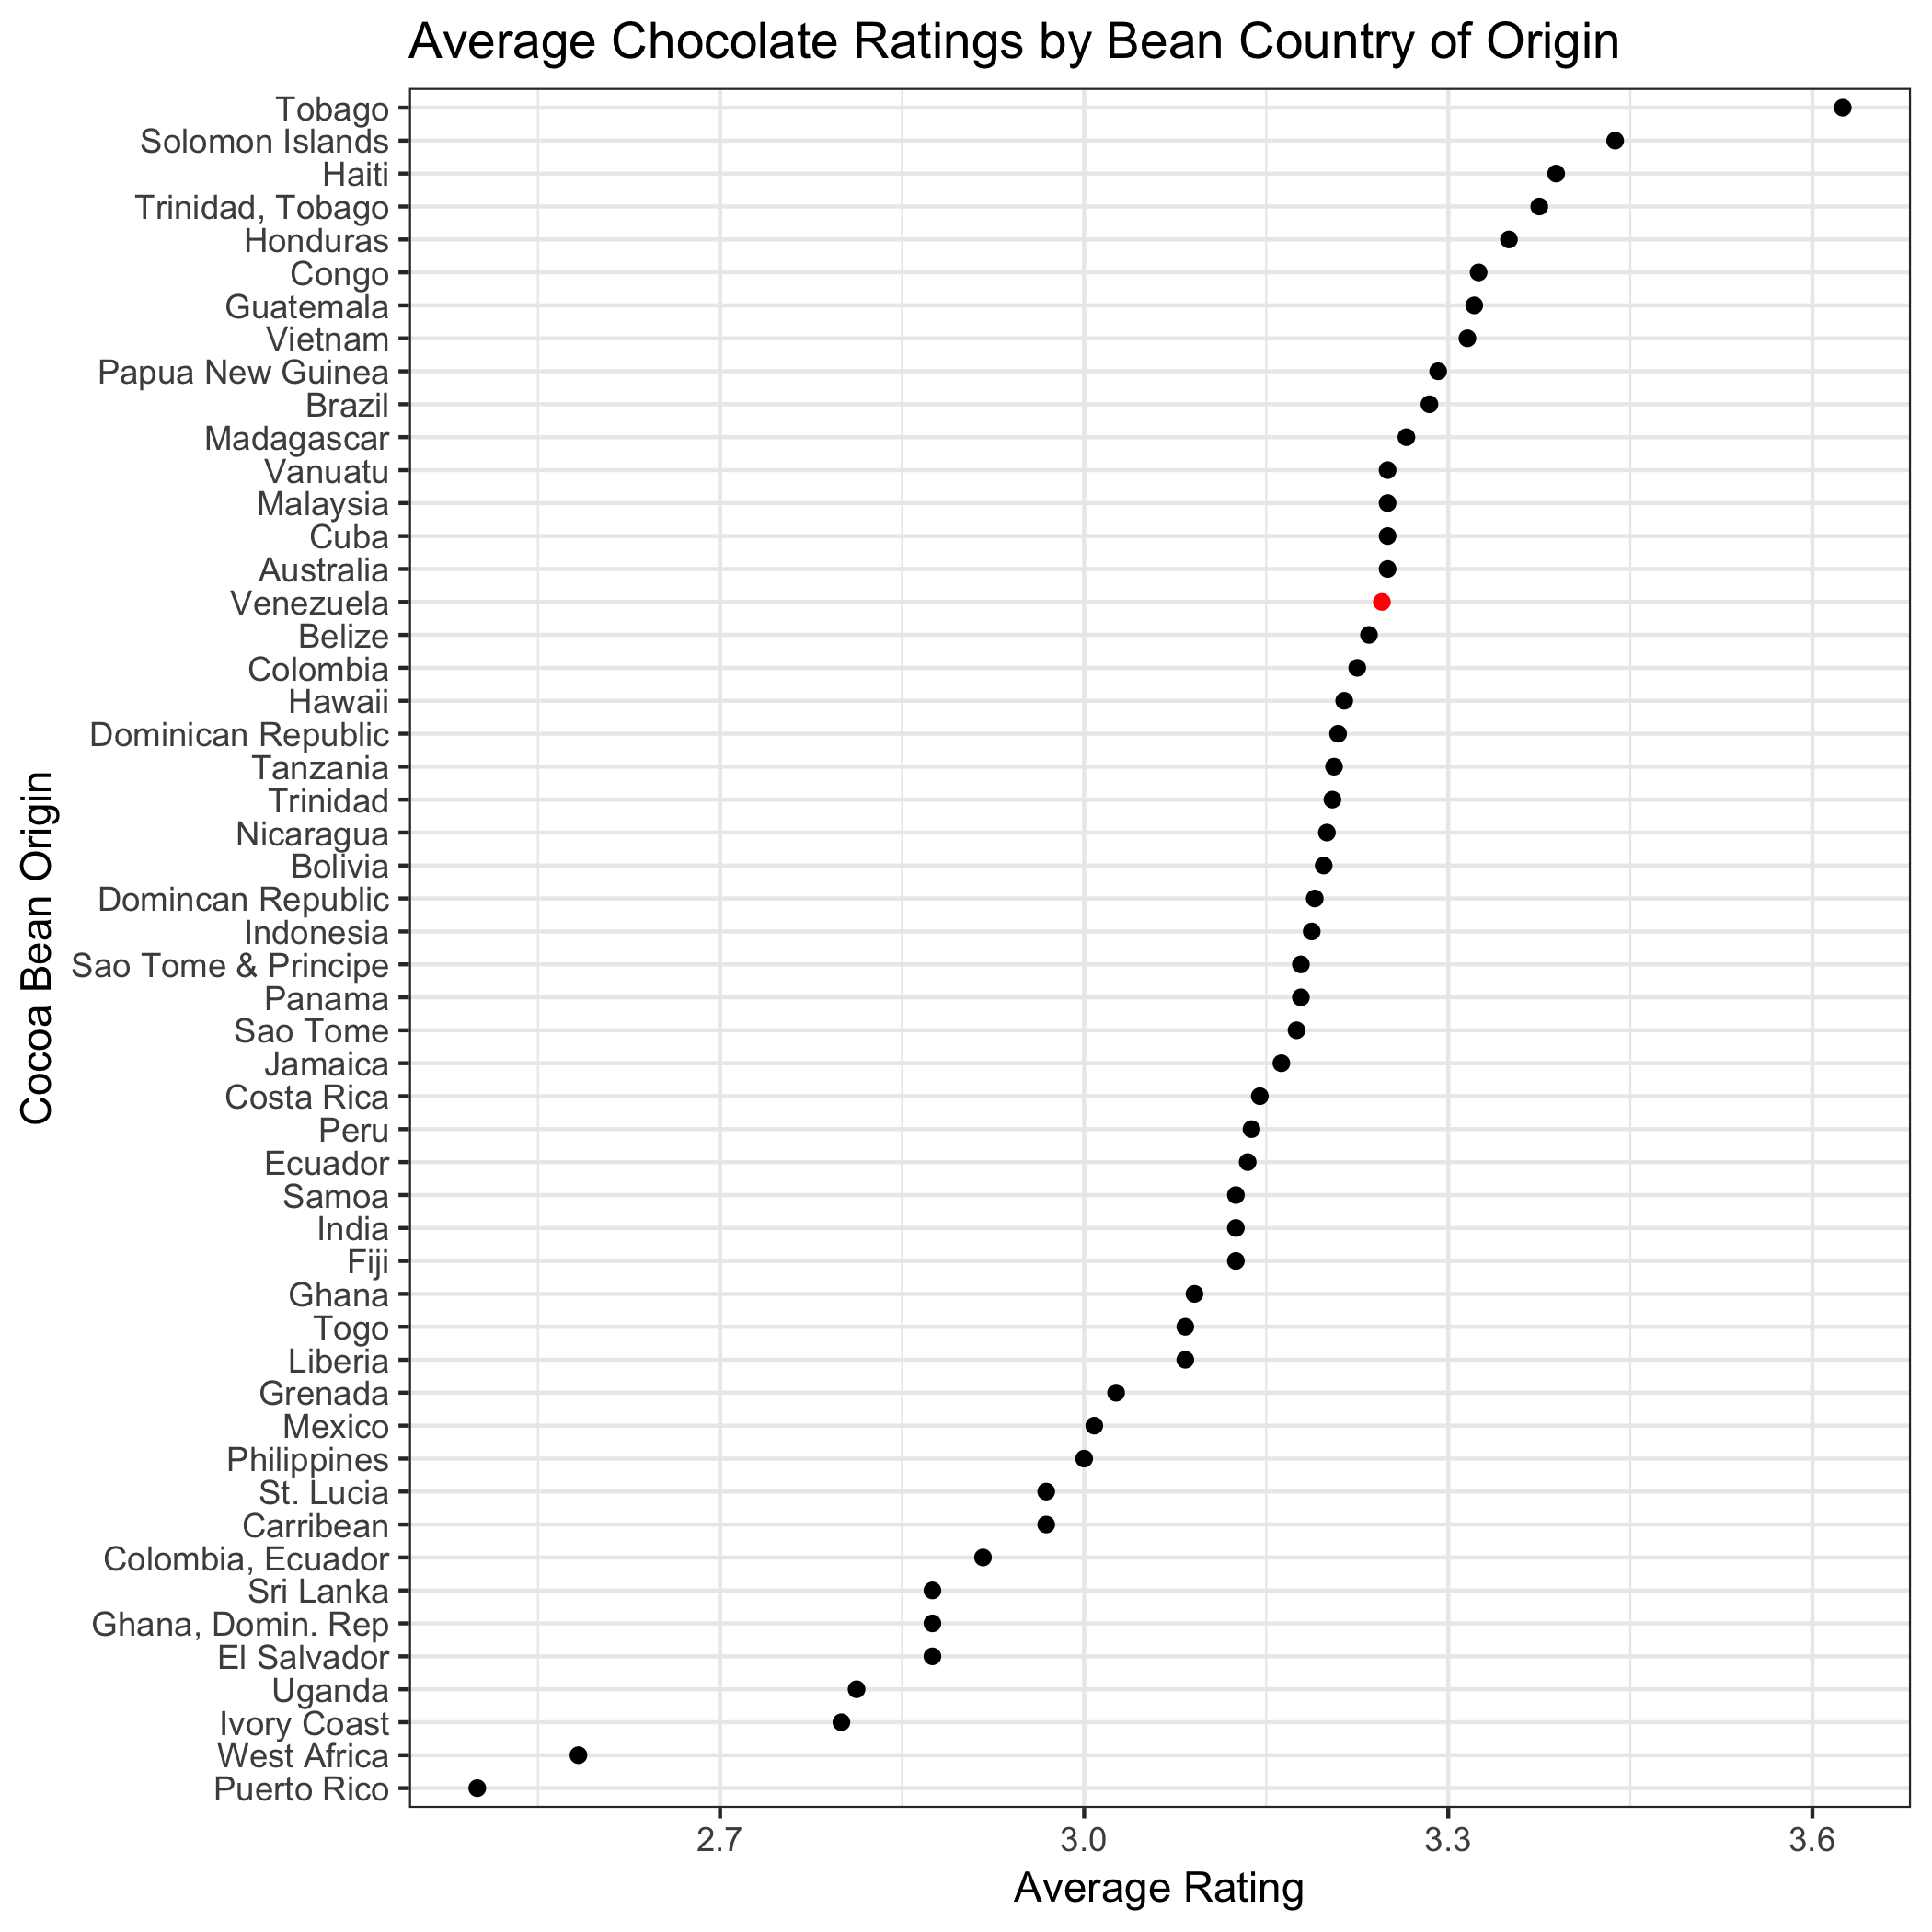
To initially get an understanding of how ratings for beans from Venezuela compare to beans from other regions, we plotted the average rating for each bean origin and highlighted Venezuela in red for contrast.
Figure 1. Mean ratings of chocolate bars by cocoa bean origin for regions which had more than one rating.
Note that in the plot, we excluded the following data:
-
Cocoa bean origin regions which only had a single associated chocolate bar rating. This eliminates “one off” chocolate bars which only had a single rating, which keeps the plot above simple and readable. However, those rows were included in our statistical analysis.
-
Large cocoa bean origin regions - for example, beans labelled broadly as grown in “South America”. Since we cannot idenfity what specific country or combination of countries these beans are from, we removed the associated chocolate bars from both the above plot and our analysis.
From the plot, we can see that Venezuela is in the upper half of average rating scores; however we cannot tell whether the mean for Venezuela is significantly different from this visualization.
Statistical Analysis Summary
To answer our question, we re-formulated it into the following hypotheses:
H0: There is no difference in the average rating of chocolate bars made with beans grown in Venezuela and chocolate bars made with beans grown in other parts of the world.
HA: There is a difference in the average rating of chocolate bars made with beans grown in Venezuela and chocolate bars made with beans grown in other parts of the world.
A two-sample hypothesis test was conducted where the test statistic is the difference between two means. The means in this case are the average rating for chocolate bars made with beans grown in Venezuela and the average rating for chocolate bars made with beans grown elsewhere. We used simulation to generate a sampling distribution of the test statistic under the null hypothesis model.
We also computed the sample test statistic (delta_star), a 95% confidence interval, and the p-value:
Table 2. Calculated sample test statistic, lower and upper confidence interval, and p-value.
| delta star | lower CI | upper CI | p-value |
|---|---|---|---|
| 0.0572017 | -0.0669535 | 0.0678817 | 0.0957 |
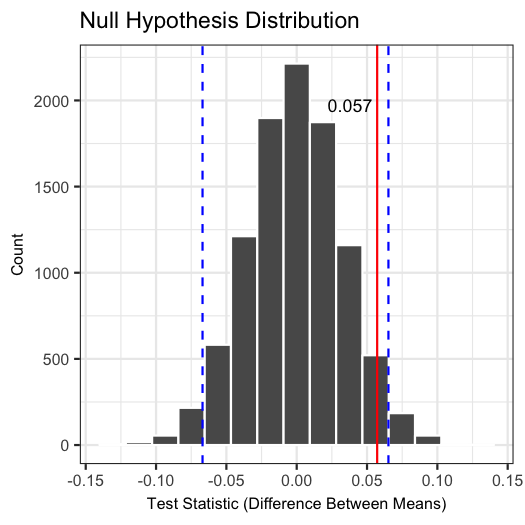
The null hypothesis distribution is visualized below as a histogram overlaid with the sample test statistic in red to show where it fell in relation to our confidence interval:
Figure 2. Distribution of test statistic (difference between mean ratings for chocolate bars made with beans from Venezuela and chocolate bars made with beans from elsewhere) under the null hypothesis model generated by permutation. Blue dashed lines represent the range of a 95% confidence interval. Red solid line represents the test statistic from the chocolate data set.
Results
From the plot, we can see that it is not unlikely to obtain a test statistic as extreme as the one observed in our sample data under the null hypothesis. In addition, based on an alpha threshold set at 0.05 and a calculated p-value of 0.0923, we fail to reject the null hypothesis.
In this analysis, we conclude that there is not enough evidence to suggest that there is a difference in the average ratings of chocolate bars made with beans grown in Venezuela versus other regions.
Limitations
Some chocolate bars were made with beans from more than one location (e.g. Venezuela and Java). We grouped only those that listed Venezuela alone as being from Venezuela, and decided to categorize the more ambiguous case of chocolate bars made with a combination of beans grown in both Venezuela and other countries into the ‘Other’ category
A future direction could be to expand the definition of the Venezuela category to include bars made with beans from Venezuela as well as other regions, rather than excluding them from this group. Alternatively, we could create a third group, which would be chocolate bars made with beans grown from a combination of locations that do include Venezuela.
This post was authored jointly by myself and Carrie Cheung.
Photo by Charisse Kenion on Unsplash